
278 km/h on the Shinkansen: What a GPS Speedometer Records on a Bullet Train
A GPS speedometer filmed on a Shinkansen in October 2024 held 276–278 km/h and logged 13.2 km in 2:51. Here are the numbers, and why the app's top speed says 283.
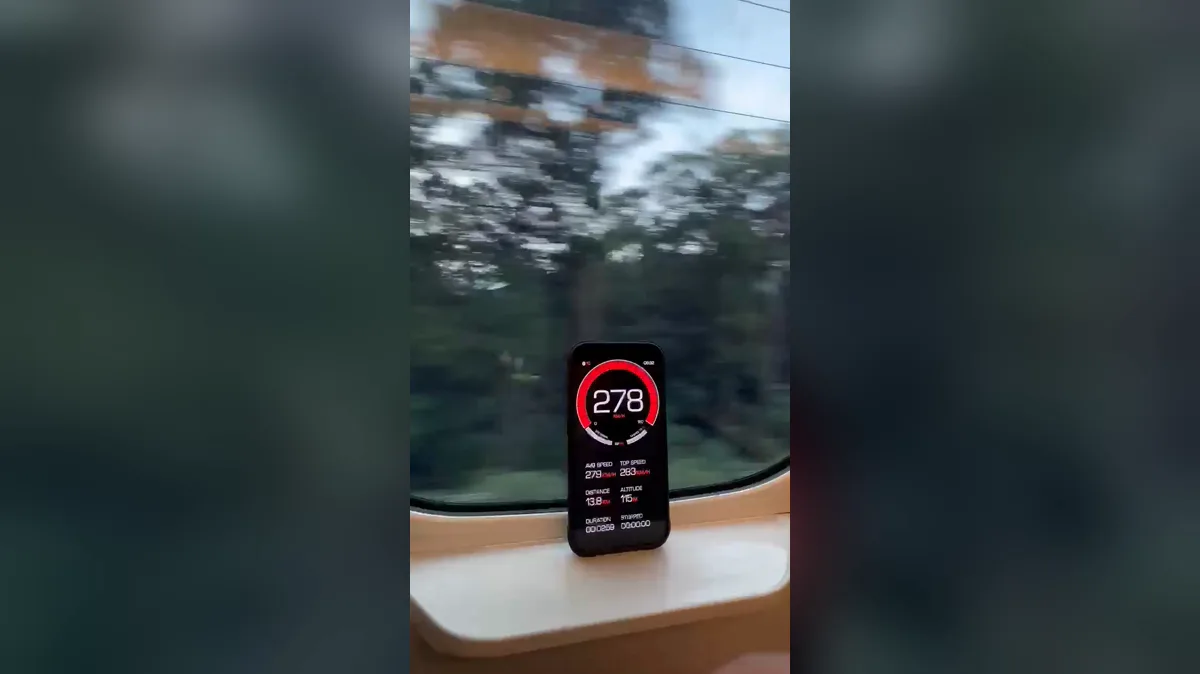
Table of Contents
In footage recorded on a Shinkansen in October 2024, a phone standing on the window sill read 278 km/h (172.7 mph)278 km/h at its highest visible point and held 276–278 km/h (171.5–172.7 mph)276–278 km/h throughout. Its trip log showed 13.2 km (8.2 miles)13.2 km covered in 2 minutes 51 seconds, an average of 279 km/h (173.4 mph)279 km/h, and a trip maximum of 283 km/h (175.9 mph)283 km/h.
The run, as the phone saw it
The footage is not ours. A friend of the team shot it on a Shinkansen ride in October 2024, running our GPS speedometer on their own phone, and passed the clip along afterwards. Everything below is read off that recording frame by frame — nobody set this up as a test, and we are not going to present it as one.
The setup, such as it is: no mount, no window suction cup, no cradle. The phone is simply standing upright on the sill below the window, leaning on the glass, with the app’s trip computer visible under the dial. A second camera filmed the screen, so nothing here is a screen recording — it is the readout as a passenger in that seat actually saw it.
At this speed the train is covering 77 metres (253 feet)77 metres of track every second. The pylons carrying the overhead line arrive and vanish inside a single frame of video; a field that fills the window is behind you before you have finished looking at it. The readout is the only part of the scene that stays still enough to read, which is presumably why the phone was propped there in the first place.
The trip computer was showing this when the clip was filmed:
| Field | Reading |
|---|---|
| Speed on the dial | 277 km/h (172.1 mph)277 km/h |
| Top speed (trip) | 283 km/h (175.9 mph)283 km/h |
| Average speed (trip) | 279 km/h (173.4 mph)279 km/h |
| Distance (trip) | 13.2 km (8.2 miles)13.2 km |
| Altitude | 114 m (374 feet)114 m |
| Duration | 00:02:51 |
| Stopped | 00:00:00 |
Key takeaways
- The live readout sat inside a 2 km/h (1.2 mph)2 km/h band for the entire 21.6-second recording, taking three values: 276, 277, 278. At nearly 280 km/h (174 mph)280 km/h that is a spread of under 1%.
- The trip log checks itself. 13.2 km (8.2 miles)13.2 km in 2:51 works out to 277.9 km/h (172.7 mph)277.9 km/h — within about 1% of the 279 km/h (173.4 mph)279 km/h the app displayed as its average, and effectively on top of the number on the dial.
- The maximum and the dial disagree by 5 km/h (3.1 mph)5 km/h, and both are right. A trip maximum is the single highest sample of the whole run; the dial is one instant. The video covers about an eighth of the trip.
- A window seat is not a clear sky view, and the reading held anyway. Glass attenuates the signal but does not block it the way a tunnel roof does.
- The average is the honest number. As with a two-way boat speed run, the maximum tells you about one second; the average tells you about the journey.
The speed profile: a 2 km/h band for three minutes
The interesting thing about this recording is how boring it is. Over 21.6 seconds the number took exactly three values — 276, 277, 278 — and nothing else. It never dipped, never spiked, never dropped out.
That flatness is the measurement working. GPS derives speed from the Doppler shift on the satellite carrier signal rather than by differencing two positions, so the reading does not accumulate the wander that position fixes do — the mechanics are in how GPS speedometers work. It is also why high speed itself does not degrade the reading: a receiver is about as accurate at 280 km/h as it is at 100, as long as it can see sky.
The stronger evidence is not the dial at all, it is the arithmetic hiding in the two fields below it. Distance divided by duration is an average speed the app never displays, computed from two independent counters. Sampled at three different moments in the recording:
| Distance | Duration | Distance ÷ duration |
|---|---|---|
| 12.9 km (8.0 miles)12.9 km | 00:02:47 | 278.1 km/h (172.8 mph)278.1 km/h |
| 13.2 km (8.2 miles)13.2 km | 00:02:51 | 277.9 km/h (172.7 mph)277.9 km/h |
| 14.0 km (8.7 miles)14.0 km | 00:03:02 | 276.9 km/h (172.1 mph)276.9 km/h |
Three readings inside 1.2 km/h (0.7 mph)1.2 km/h of each other, all landing within a couple of km/h of the app’s own 279 km/h (173.4 mph)279 km/h average and right on the live dial. The residual gap is about what the display’s rounding allows — distance is shown to 0.1 km (0.06 miles)0.1 km, which at this speed is a 1.3-second quantum on its own.
Altitude is the weaker axis, and it shows. Over the same 21.6 seconds it drifted between 113 and 117 m (371 and 384 feet)113 and 117 m. Some of that is real ground rising and falling under a train that covered 1.6 km (1 mile)1.6 km during the clip, and some of it is the vertical component of a GPS fix simply being noisier than the horizontal one. Either way it is a useful reminder that “GPS is accurate” is a claim about a specific quantity, not about every number on the screen.
One field is worth a second look: STOPPED read 00:00:00. Across 2 minutes 51 seconds the log never recorded a moment below its movement threshold.
Why the top speed says 283 when the video shows 278
Two numbers on the same screen, 5 km/h (3.1 mph)5 km/h apart, and the honest answer is the least exciting one: they describe different spans of time.
The video is a sample of the trip, not the trip. The clip runs 21.6 seconds. When it was filmed the trip had already been running 2 minutes 47 seconds, and it kept going afterwards. The camera saw roughly an eighth of the run. The 283 km/h (175.9 mph)283 km/h happened in the other seven eighths — most likely on a stretch of track where the train was allowed a little more than it was allowed here. Nothing needs explaining beyond that, and any explanation that skips it is reaching.
A maximum is a single sample, and a single sample sits above a sustained value. Even on perfectly steady track the reading breathes by a km/h or two — you can watch it do exactly that in the loop above. A maximum field keeps whichever of those breaths was highest, over the whole run, forever. It is the one statistic in a trip computer that gets monotonically less representative the longer you record. A ten-minute trip has ten times as many chances to catch a favourable sample as a one-minute trip, and the maximum will reflect that even if the train never behaved differently.
This is the same trap as quoting a boat’s top speed from one surf down a wave, which is why our boat speed test method is built on averaging two passes rather than reading a peak. The peak is a fact about a moment. The average is a fact about the journey.
Spike filtering is not the explanation either — because there isn’t any. It would be reasonable to assume a speed app screens physically impossible jumps out before they reach the maximum field. Ours does not: the top-speed field simply keeps the highest sample the receiver reported, and nothing inspects that value to ask whether it is plausible. The one thing dropped upstream is a fix whose own accuracy estimate is worse than a kilometre — a check on the fix, not on the speed. So 283 km/h (175.9 mph)283 km/h is not a number that survived a filter. It is simply the peak the receiver reported: the highest single sample of the run, on track already sustaining 277 under open sky, where such a value is entirely plausible. That is why it is believable — and it is still not why it sits above 278. The two points above are.
So which figure is “the speed of the train”? The 279 km/h (173.4 mph)279 km/h average, backed by 13.2 km (8.2 miles)13.2 km in 2:51 from two separate counters. The 283 is a real reading of a real moment the camera was not rolling for. The 278 is the fastest instant anyone can put in front of you on video, which is why it is the number in the title. All three are true; only one of them describes the journey. The full treatment of where these readings hold up and where they don’t is in how accurate a GPS speedometer is at high speeds.
Does this sit where a Shinkansen should?
As a sanity check rather than an identification: published operating speeds put the fastest Japanese services at 320 km/h (199 mph)320 km/h on the Tohoku line and around 300 km/h (186 mph)300 km/h on the Sanyo line, while the Tokaido line runs to 285 km/h (177 mph)285 km/h on straight track and 275 km/h (171 mph)275 km/h through curves. A sustained 276–278 with a 283 peak sits inside that envelope — comfortably below the fastest lines, and right up against the ceiling of the slowest.
Which line it was, and which train, we cannot tell you. That information did not come with the clip and will not be reconstructed after the fact — scenery is not evidence, and a plausible guess printed as a caption becomes someone else’s cited fact. The speeds are what the footage supports; the route is not.
What GPS does in a Shinkansen tunnel
This clip is on open track — flat farmland, low wooded hills, open sky above the ridgeline. That is the easy case, and it is worth being explicit that it is the easy case, because on a Japanese high-speed line it is not the whole journey. Roughly half the Sanyo line’s route runs in tunnel, and mountain sections elsewhere are similar.
Here is what happens when the daylight goes:
The signal stops, not the app. A tunnel roof is the one obstruction GPS cannot work around. Concrete and rock do not attenuate the satellite signal the way glass does; they end it. There is no fix to compute, so there is no fresh velocity to report — this is the same failure mode as a road tunnel, and the only one on the list that is total rather than degraded.
What you see depends on what the app does with nothing. Most apps do one of two things: hold the last known speed on screen, or fall back to a brief dead-reckoning estimate from the phone’s accelerometers and gyroscope. Dead reckoning is good for a few seconds and then drifts, because an inertial estimate integrates its own error. On a train it drifts unusually gracefully — a train on rails does not change speed or heading quickly, so “assume it is still doing what it was doing” is a better guess on a Shinkansen than it would be in traffic. Ours eventually shows 0: with no fixes to report, the reading falls to zero and stays there until the sky comes back — the display saying “no measurement”, not “the train stopped”.
Reacquisition is fast, and that is the part people get wrong. Coming out of a tunnel, a phone that has been tracking continuously already knows roughly where it is, what time it is and which satellites should be overhead. It is re-locking, not starting cold, so the reading is usually back within a few seconds rather than the half-minute a first fix from scratch can take. What it does not do is retroactively fill in the tunnel. Distance accrued while blind is distance the trip log never counted, so a long tunnel makes the trip total read short, not wrong — a distinction worth keeping straight when you compare an app’s distance against a timetable.
For this particular trip the arithmetic suggests nothing significant went missing: 13.2 km (8.2 miles)13.2 km over 2:51 reproduces the live readout to within about 1%, which a substantial unlogged stretch would have pulled down.
Practical consequence for a train ride: start the trip before you want the data, leave it running through the tunnels rather than stopping and restarting, and read the average rather than the distance if the route is tunnel-heavy. And note that none of this needs a signal on your phone — GPS speed is computed from satellites, so it works with no data connection at all, which matters more abroad than at home.
Where these numbers come from
Provenance. The footage was recorded in October 2024 by a friend of the team, on a Shinkansen, on their own phone, running our GPS Speedometer app set to km/h. It was given to us afterwards. We did not commission it, specify it or supervise it.
Every figure in this post is read off the app’s on-screen display in that footage. There is no separate data file, no exported GPX track and no telemetry behind these numbers — only the trip computer as filmed, transcribed frame by frame. Where a value moves during the clip we have given the range rather than picking the flattering end.
What is in the recording. 21.6 seconds, portrait, 30 frames per second, filmed with a second camera pointed at the phone’s screen. The trip had already been running 2 minutes 47 seconds when filming began. The loop above is an eight-second cut from it. Nothing was sped up, slowed down or composited.
How the phone was positioned. Standing upright on the window sill of the carriage, leaning back against the glass, unmounted. No suction cup, no external antenna, no gimbal.
What is not known, and will not be filled in later. The line, the route, the train type and the phone model. None of it came with the clip. We would rather leave four blanks than publish four guesses that get quoted back at us as facts.
The app is not the current version. October 2024 predates the releases shipping today, so the screen in the footage is an earlier build of the same trip computer. The fields quoted here — speed, average, top speed, distance, altitude, duration, stopped — are the ones it was showing then. Nothing in this post should be read as a claim about what today’s version does differently.
What was not controlled. No reference instrument. No trackside timing, no in-car speed display in frame, no second GPS device. The only cross-check available is the app’s own distance and duration against its own speed, which is a genuine consistency check but not an independent one. Published line speeds are the sole outside comparison here, and they can only say the reading is plausible.
Other honest limitations. One ride, one phone, one clip covering about an eighth of the logged trip. Speed was steady throughout, so this says nothing about how the reading behaves accelerating out of a station or braking into one. The phone was behind train glass rather than under open sky. And the 113–117 m (371–384 feet)113–117 m altitude wobble is a standing reminder that the vertical figure deserves less confidence than the horizontal one.
Frequently Asked Questions
Does a GPS speedometer work on a train?
Yes, and a train is one of the better places to use one. The reading comes from satellites rather than from anything attached to the vehicle, so it needs no connection to the train and no data connection on your phone — only a view of the sky. A window seat is enough: in this recording a phone leaning against the carriage glass held a steady 276–278 km/h and logged 13.2 km in 2 minutes 51 seconds. The exception is tunnels, where the signal stops entirely until you come back out.
Why does my speed app’s top speed not match what I see on screen?
Because they measure different spans of time. The dial shows one instant; the top-speed field keeps the single highest sample from the entire trip and never lets it go. On this run the dial was showing 277 km/h while the trip maximum stood at 283 km/h, recorded at some earlier point in a journey the camera only caught an eighth of. A maximum also drifts upward the longer you record, because a longer trip simply gives the receiver more chances to catch one favourable sample. If you want a number that describes the journey rather than a moment, read the average.
Does a GPS speedometer keep working in a tunnel?
Not while you are inside one. A tunnel roof blocks the satellite signal completely, so there is no position or velocity to compute — the app will either hold the last speed it saw or estimate briefly from the phone’s motion sensors, which stays useful for a few seconds and then drifts. Reacquisition on the way out is quick, usually a few seconds, because the receiver is re-locking rather than starting cold. The lasting effect is on distance: kilometres travelled underground are never added to the trip total, so on a tunnel-heavy route the logged distance reads short.
Sources & further reading
- Tokaido Shinkansen — speed increase to 285 km/h (Railway Gazette) — the 285 km/h maximum on straight track and 275 km/h through curves quoted above.
- Tokaido Shinkansen (Wikipedia) and San’yō Shinkansen (Wikipedia) — line speeds, and the roughly 50% of the Sanyo route that runs in tunnel.
- GPS Standard Positioning Service performance (gps.gov) — the official civilian accuracy specification behind the velocity claims.
- How accurate is a GPS speedometer at high speeds? — why error stays flat as speed rises, and the failure modes that actually matter.
- How to test your boat’s real speed with GPS — the same measurement discipline applied on water, and the argument for averages over peaks.
The takeaway
A phone standing on a window sill, with no mount and no connection to the train, reported the speed of a bullet train to within about 1% of what its own distance and duration counters imply. Getting the number was not hard. Reading it honestly was the work: three real figures on one screen, describing an instant, a peak and a journey, none of them interchangeable.
You can watch the same three numbers behave the same way on anything that moves. If you want to see a live GPS speed reading without installing anything, the online speedometer runs in your browser. If you want the trip computer — maximum, average, distance, altitude and duration logged per journey, in km/h, mph or knots — that is the app.
Download GPS Speedometer and record your next long trip, on rails or otherwise. Core speed tracking works offline with no data connection; optional PRO features are available.